
GIS is more than just creating electronic maps. Anyone can do that in graphics software. The key is that underlying data associated with the visual map are created, managed, related, analyzed and visualized seamlessly in a GIS. You can map where certain elements exist (i.e., the Urban Ecology Center snake cover boards). Or, you can find out what is near to something you're interested in (i.e., exact distance to the next bus stop for example) or how things have changed over time (i.e., deforestation over 20 years in the Amazon). Or you can map trends in populations of humans (i.e., census information). GIS is really a problem solving tool and there are applications for GIS in many fields, from the environment to business to health.
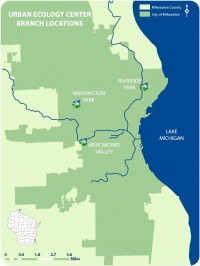
GIS software has advanced greatly since Tomlinson’s early (1960s) efforts. Thanks to a non-profit license, the Urban Ecology Center uses ESRI’s (Environmental Systems Research Institute) ArcGIS software to map a variety of data about our branches and parks. We’ve created hundreds of maps for and about our plant and wildlife communities, physical features, park trails, adventure racing routes, maple sugaring trees, branch locations and park boundaries, and volunteer demographics - just to name a few.
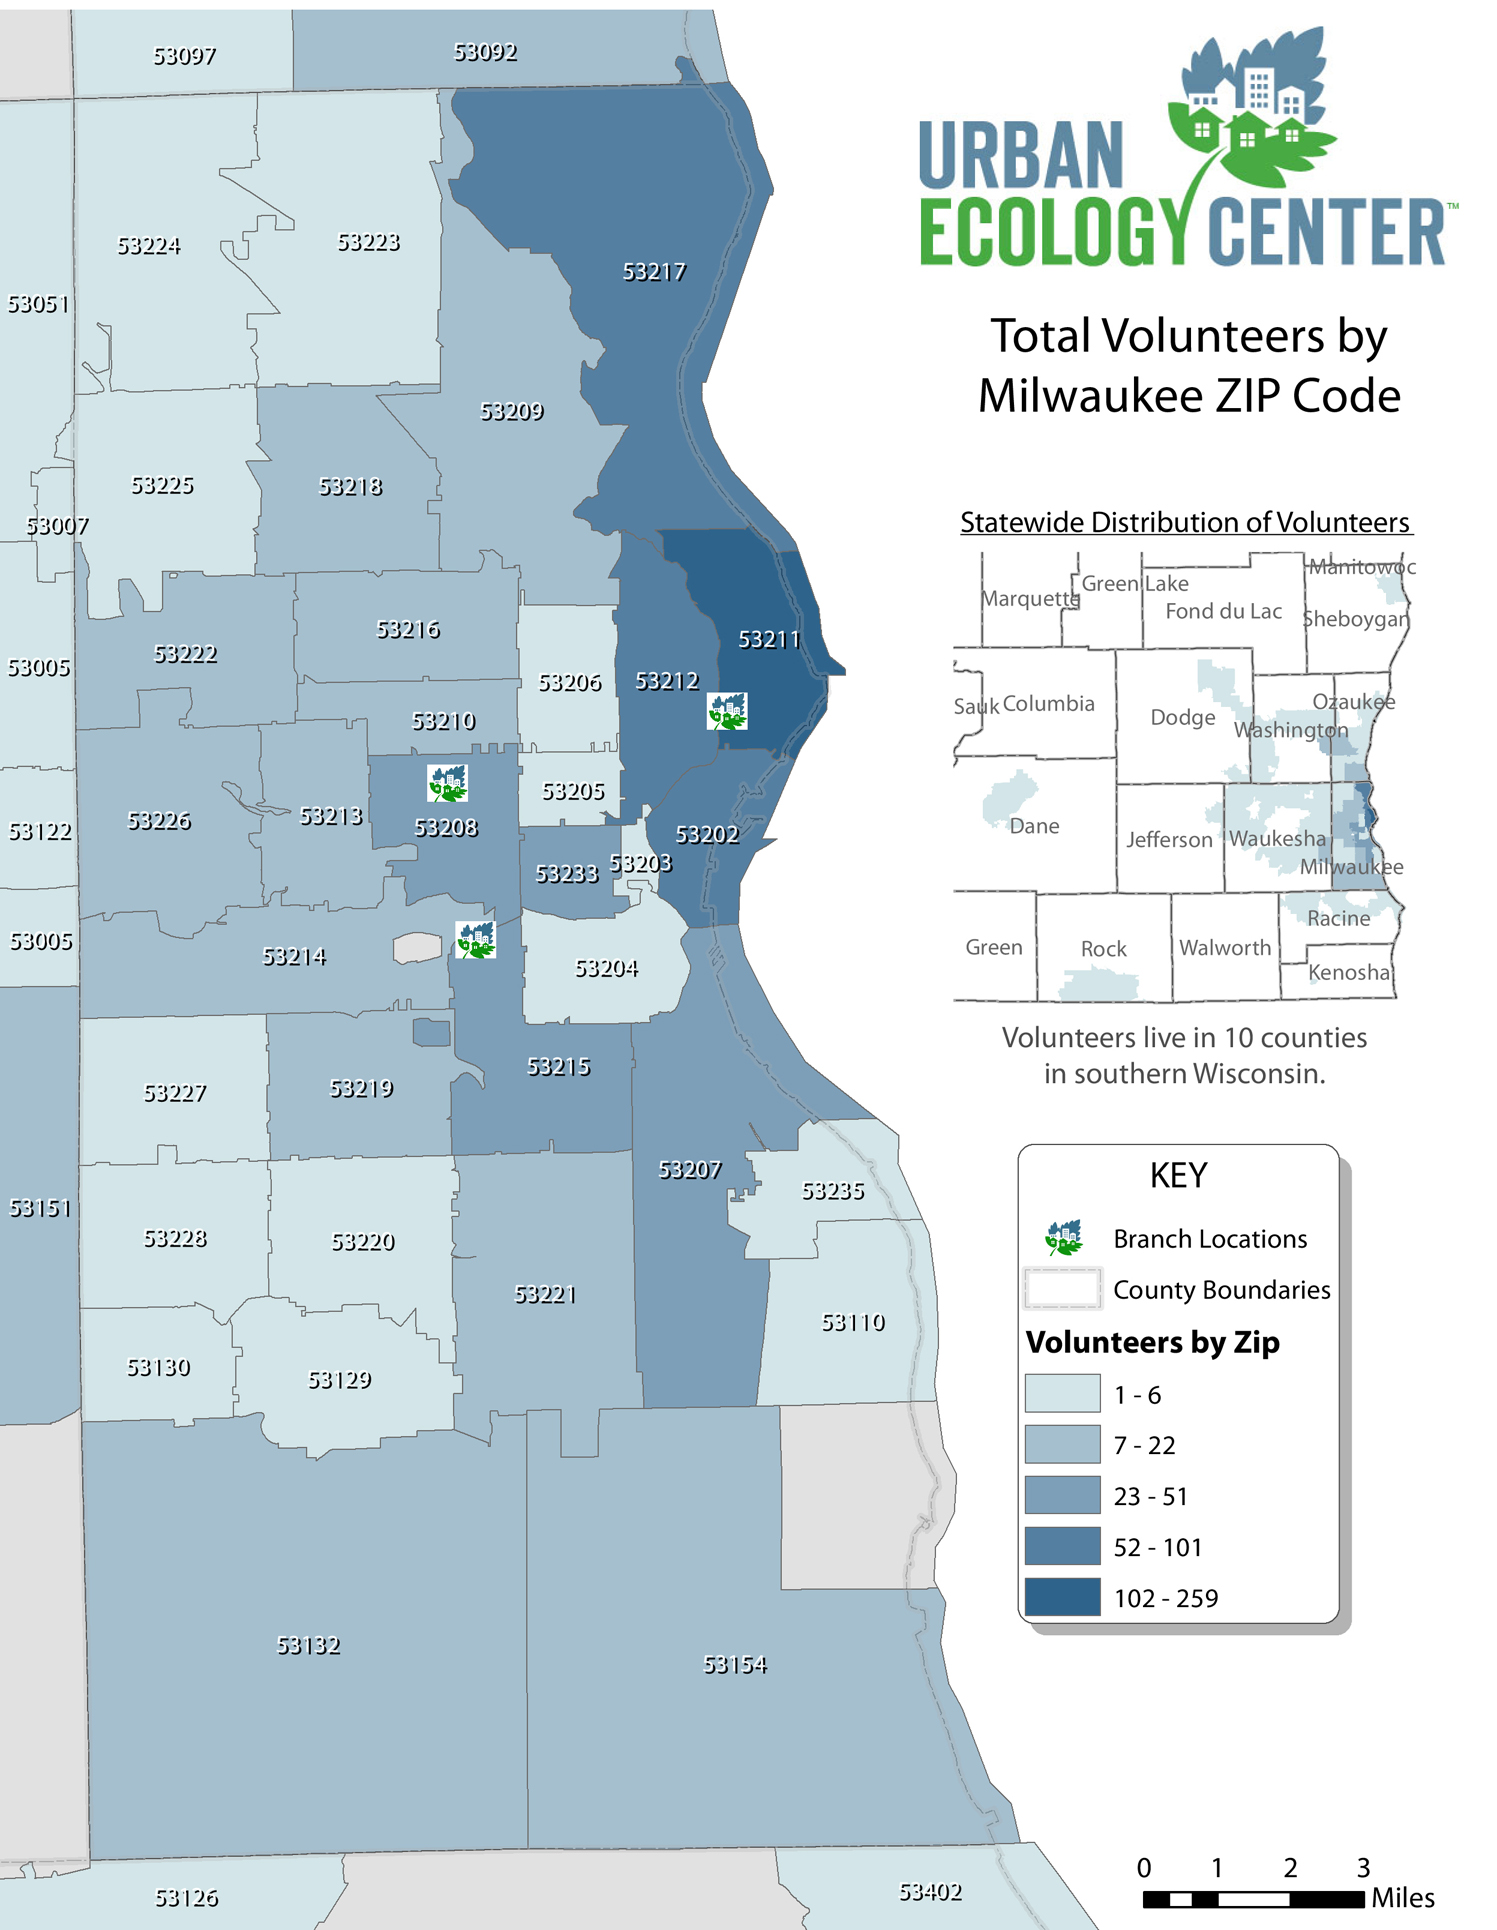 For example, based on an anlaysis of our volunteer data, we've found that most of our volunteers live in the 53211 zip code, and that some of our volunteers travel from many counties away! In order to create this kind of map, we had to acquire some supporting data first, such as the Wisconsin county boundaries and the zip codes within each county. Then we needed to relate the summary information of our volunteer data (number of volunteers by zip code) to those boundaries. Finally, we needed to symbolize this data in a meaningful way using darker colors to indicate higher quantities of volunteers by zip code. Overall, this shed some pretty interesting results!
One of the most recent maps we’ve created is our 2014 prescribed burn plan (below) for our prairie communities in both Washington Park and Riverside Park. This will be the first year we have proposed burning in Washington Park. We have kept track of our prescribed burn schedule for the last 2 years in the Arboretum (Riverside Park), rotating based on plantings and where we’ve smothered the invasive reed canary grass. 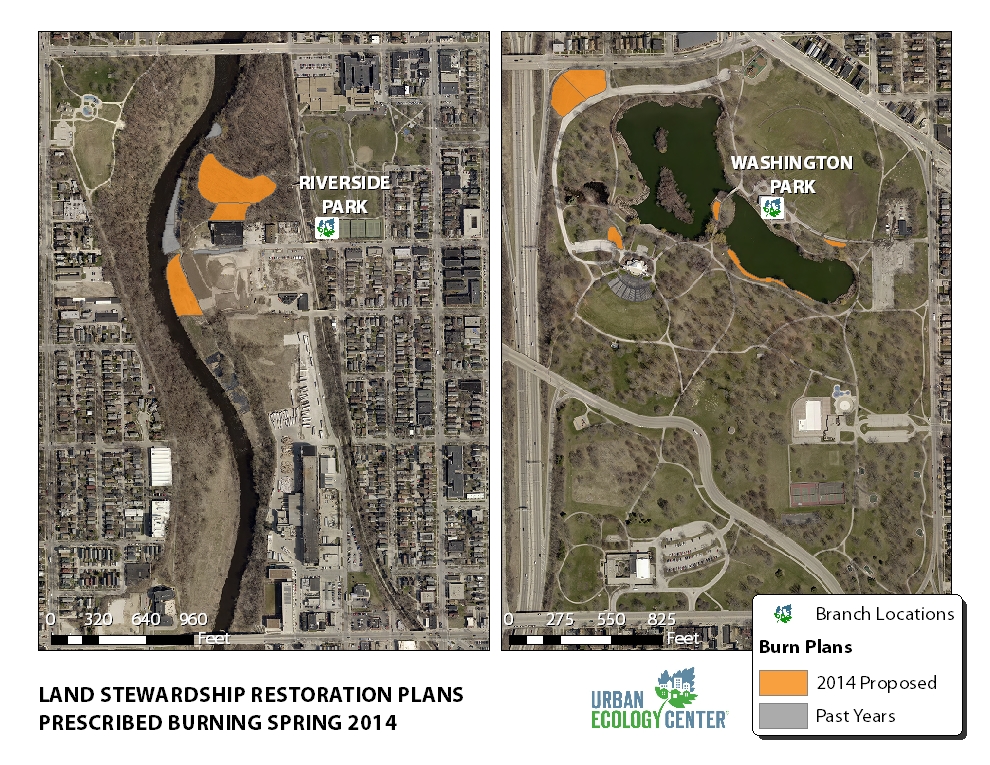 But you don’t need a specialized software to create maps or visualize data. Any citizen can access and create maps using applications like Google Earth and Google My Maps, OpenLayers, MapBox, and ArcGIS Online. Mapping applications relevant to the Urban Ecology Center include Project Noah and eBird. Both of these applications provide simple maps for ecological, botanical and zoological data. You can visualize examples of real-life GIS applications with the weekly bird walk data the Center collects on eBird. Our three branches are hotspots and you can access the data via this map. Just type in the branch name in the Location field. Stay tuned for more information on Urban Ecology Center missions using Project Noah.
Get Involved!
If you are interested in GIS or maps, there are some upcoming volunteer opportunities to get involved in once spring arrives. We are currently mapping the locations of all our larger trees in both the Milwaukee Rotary Centennial Arboretum (Riverside Park) and Washington Park. And, we’ll be mapping locations of some of our wildlife surveys in the Menomonee Valley, so please check the Weekly R&R for upcoming volunteer opportunities. Or, please let us know if you have ideas for GIS and mapping projects as it pertains to Riverside Park, Menomonee Valley and Washington Park. GIS has a long history of public participation and we have plenty of community science projects that having mapping components. We welcome your input. For more information, please contact Anne Reis at This email address is being protected from spambots. You need JavaScript enabled to view it..
“A map does not just chart, it unlocks and formulates meaning; it forms bridges between here and there, between disparate ideas that we did not know were previously connected.” - Reif Larsen, The Selected Works of T.S. Spivet