 Lindsey earned her bachelor’s degree in zoology and sustainability from Miami University in Ohio, before enrolling in Madison’s Environmental Conservation program, which appealed to her because of its focus on experiential learning. She “didn’t know GIS existed” until her last semester of undergrad, but when the buzz around it picked up, she signed up for a GIS course and found that programs like ArcGIS were a good companion to her visual mind. A graduate-level course “really ignited a passion for GIS,” Lindsey said recently, and she began to consider its implications as a tool to aid efforts in conservation and sustainability.
Lindsey Bereckis is partnering with the Urban Ecology Center this summer to map species richness and biodiversity in the areas surrounding each of our three branches. Photo credit: Lindsey Bereckis.
Lindsey’s hometown is Chicago, and she finds that growing up there has given her an eye for urban ecology in particular. “I was born in a city; I grew up in a city; so I’m partial to cities,” she said. A faculty member in Lindsey’s program who is familiar with the UEC spied a match made in ArcGIS, and facilitated Lindsey and Amanda’s working relationship.
The Environmental Conservation program has a history of partnerships with the UEC. The Branch Director for our Menomonee Valley branch, Angélica Sanchez, and our former Animal Care Specialist, Haley Marzolf, both initially came to us through the program.
Lindsey said her goal at the beginning of the summer was “to learn as much as [she] could.” Fortunately for our readers, she’s taken that goal seriously.
The data indicate that within a one-mile radius of each UEC branch, Riverside Park’s species richness—that is, the total number of species counted in the past four years—falls at 291 species. Washington Park’s species richness is 209 species, and Menomonee Valley’s is 199.
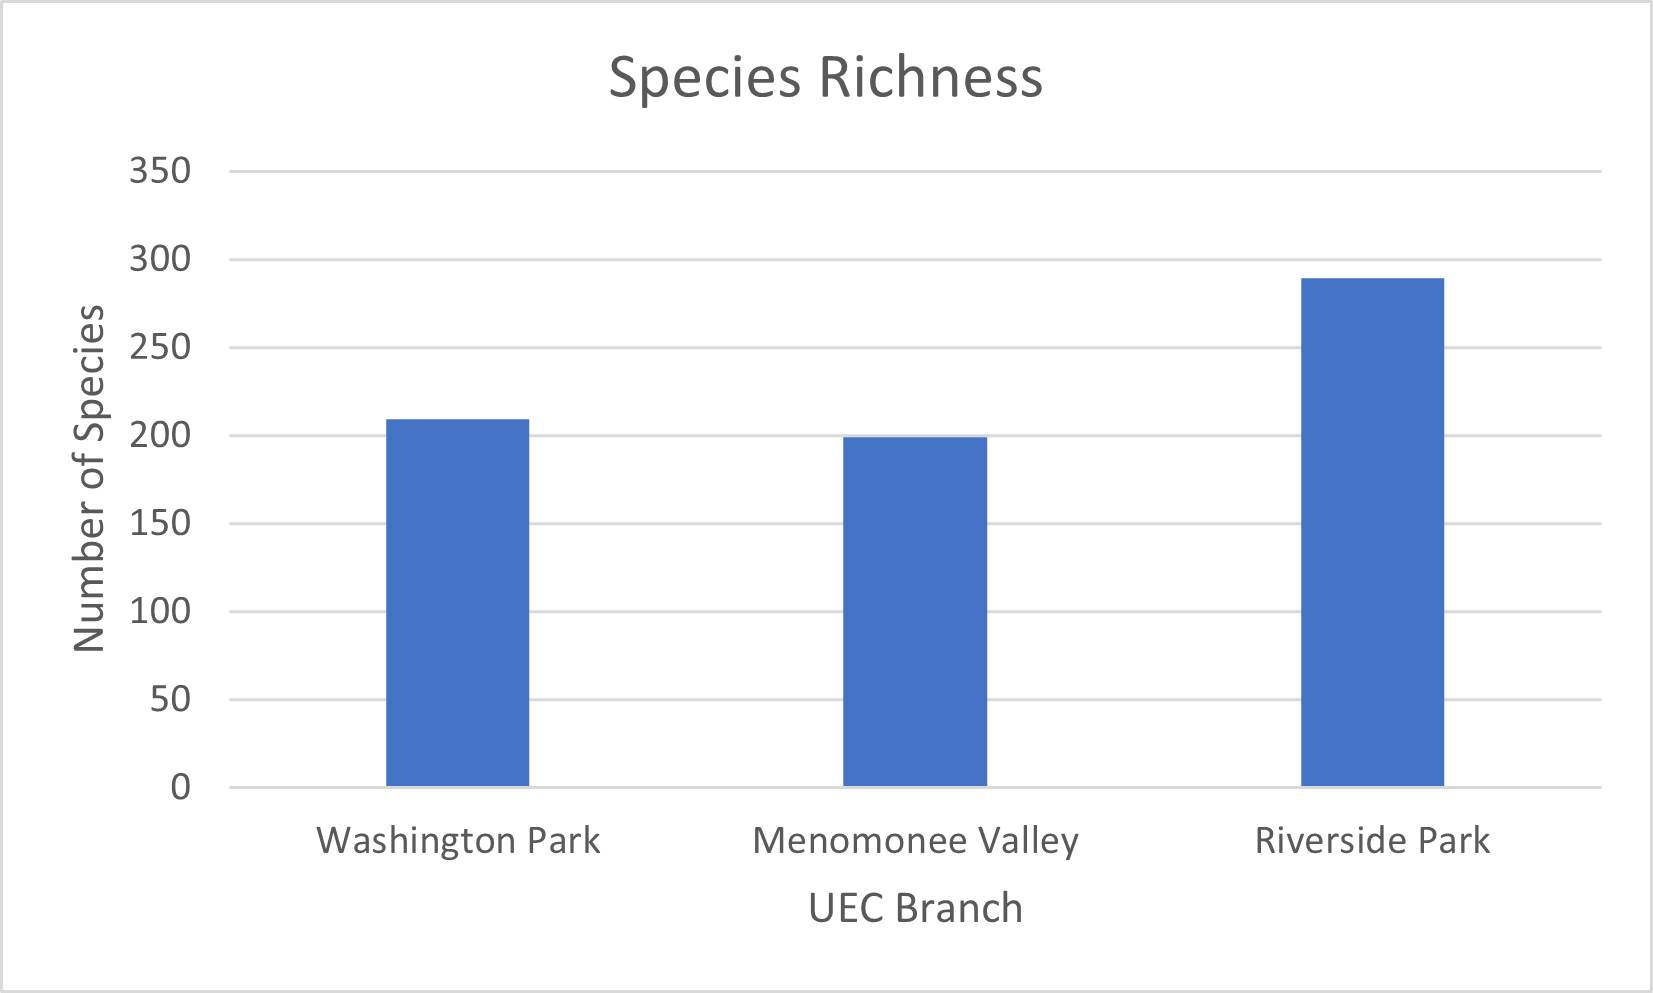
An example of the data visualizations that Lindsey created this summer. Credit: Lindsey Bereckis.
Lindsey used Excel to calculate the Simpson’s Diversity Index (SDI) for each branch as well. When SDI is used to calculate biodiversity, it considers the relative abundance of each species in addition to the number of species present. For example, an ecosystem that is home to many different species but that is dominated by members of one or two of those species would be considered unstable by most ecologists, and would therefore earn a lower SDI (closer to 0). An ecosystem with high species richness, as well as a similar number of individuals within each species, would earn a higher SDI (closer to 1). When Lindsey’s calculations are compared with Lindsey’s species richness data, they reveal a pattern: Riverside Park is the branch with the highest SDI, at 0.97; Washington Park’s follows closely at 0.95; and Menomonee Valley’s reaches 0.89.

Another aspect of Lindsey's work this summer. Credit: Lindsey Bereckis.
A couple of factors may be influencing these results. Community scientists, or community members without formal scientific training who collect data on a volunteer basis, are the backbone of many research initiatives, especially those seeking to map species richness and abundance. The UEC’s own volunteer-driven research outings, like our bird walks and monarch larva surveys, share hundreds of valuable data points each week with organizations like the Cornell Lab of Ornithology and the Saint Paul-based Monarch Joint Venture. These observations would be impossible for one team of professional researchers to collect unassisted. Community scientists are reporting data consistently and frequently—whether they’re using iNaturalist to record an indigo bunting while they’re out for a solo morning stroll, or pointing out an orange slime mold to other volunteers during one of the UEC’s fungi forays. 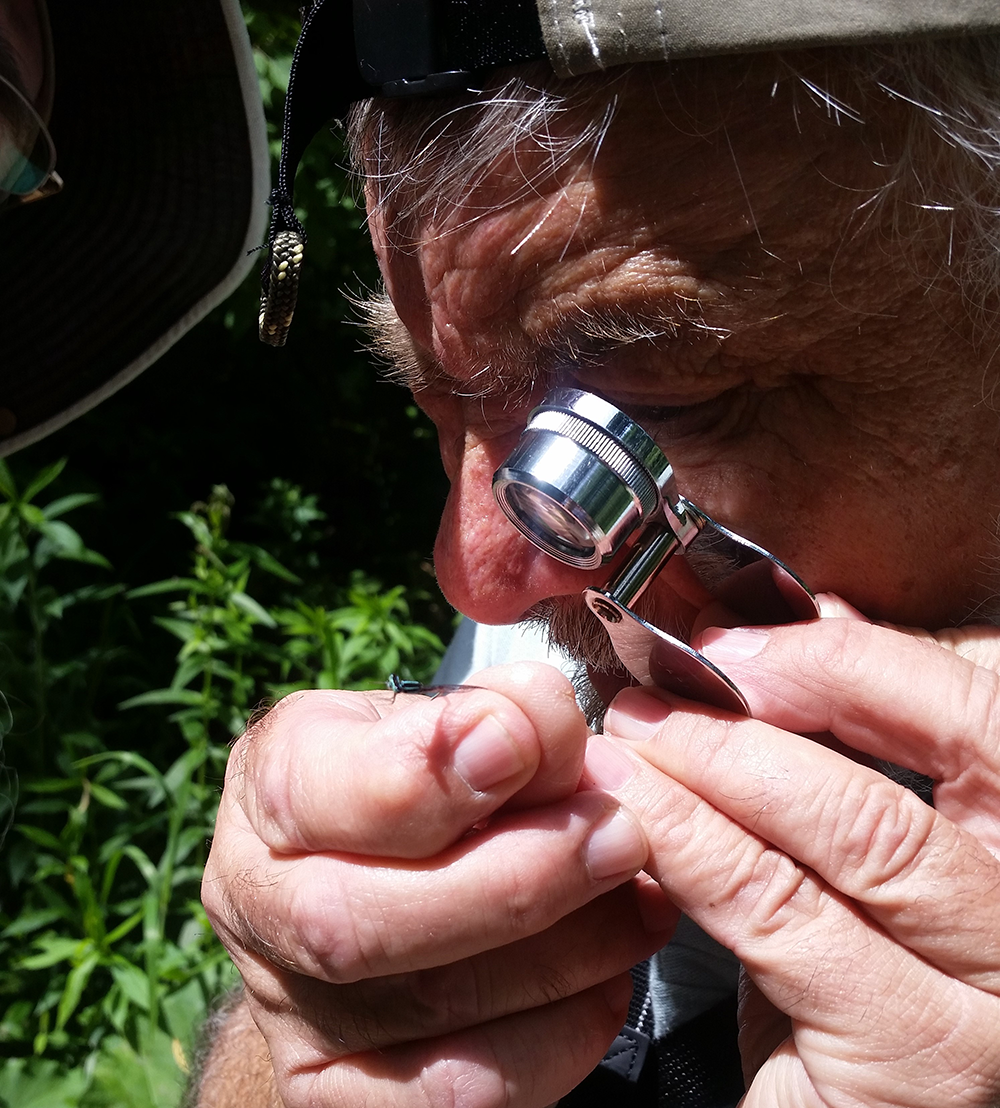
However, community scientists may be inadvertently collecting data on their own abundance as well. It stands to reason that because the pedestrian counter stationed at Riverside Park documents the highest number of visitors per year compared to those at our other branches, more data have been recorded there. It’s also the park in which the UEC has had a presence for the longest, although we already had a building in all three locations in 2019, the earliest year Lindsey took into account for these analyses.
A community scientist uses a hand lens to examine a damselfly during an odonate survey. Photo credit: Ann Graf.
In addition, Riverside Park is located in the neighborhood with the highest median income compared to Washington Park and the Menomonee Valley. Community members with higher incomes may be more likely to have the free time and resources that allow them to volunteer for research surveys or collect data as a hobby.
With the data Lindsey has on hand, it’s also difficult to determine to what extent lower species richness and SDI numbers are a reflection of the resources available for community scientists in those neighborhoods, or to what extent they’re a reflection of the previously-documented impacts of redlining and environmental racism on biodiversity.
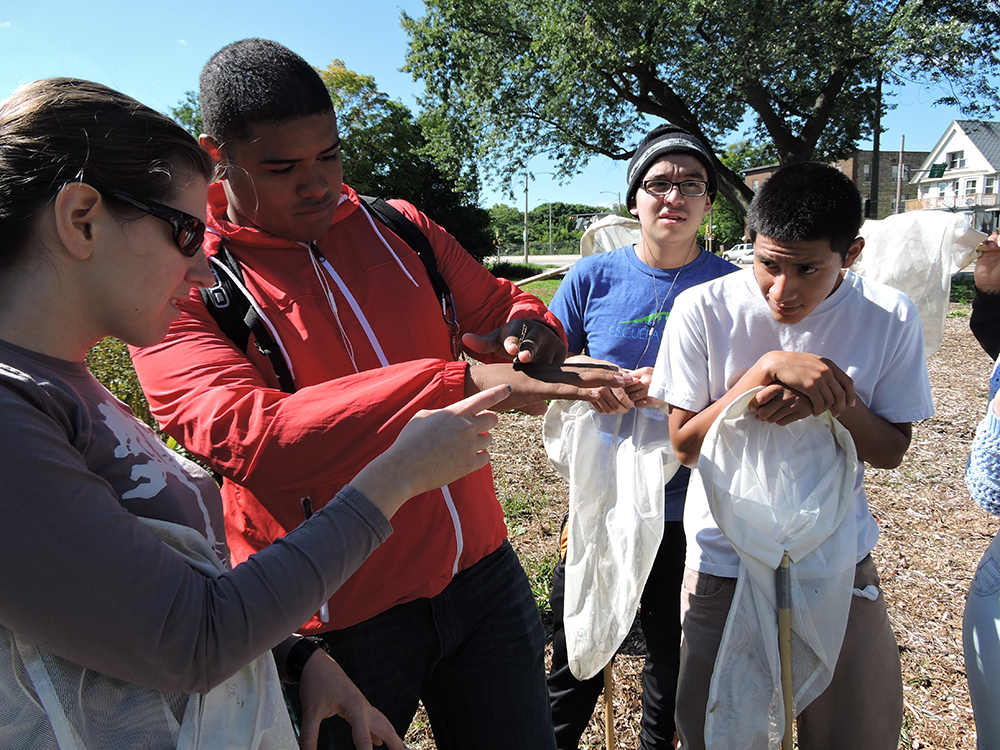
A group of NEEP studients participate in an odonate survey. Photo credit: Anne Reis
“A lot of people are willing to participate” in wildlife monitoring, Lindsey said. “They just need the opportunity […] more people participating in [community] science could beef up the numbers, and it would be nice to have more people out in nature recording species.”
Lindsey will be wrapping up her project at the end of August. She’ll be sharing her progress with guests at an installment in our Backyard Naturalist series on August 11.